
Walmart-Recruiting—Store-Sales-Forecasting
Objective
Predicting store sales using historical sales data for 45 Walmart stores located in different regions.
Introduction
Modeling retail data based on historical sales data to predict store sales is very important for Walmart’s strategic decision-making process. Accurate data ensures that stock replenishment is in line with future demand, which can help retaillers improve customer staisfaction. Forecasting is often used to adjust ads and marketing campaigns, and it can influence the number of sales.
stores.csv
This file contains anonymized information about the 45 stores, indicating the type and size of store.
train.csv
This is the historical training data, which covers to 2010-02-05 to 2012-11-01.
Store - the store number
Dept - the department number
Date - the week
Weekly_Sales - sales for the given department in the given store
IsHoliday - whether the week is a special holiday week
test.csv
The same as the train.csv except IsHoliday Column
features.csv
This file contains additional data related to the store, department, and regional activity for the given dates. It contains the following fields:
Store - the store number
Date - the week
Temperature - average temperature in the region
Fuel_Price - cost of fuel in the region
MarkDown1-5 - anonymized data related to promotional markdowns that Walmart is running. MarkDown data is only available after Nov 2011, and is not available for all stores all the time. Any missing value is marked with an NA.
CPI - the consumer price index
Unemployment - the unemployment rate
IsHoliday - whether the week is a special holiday week
Performance metric
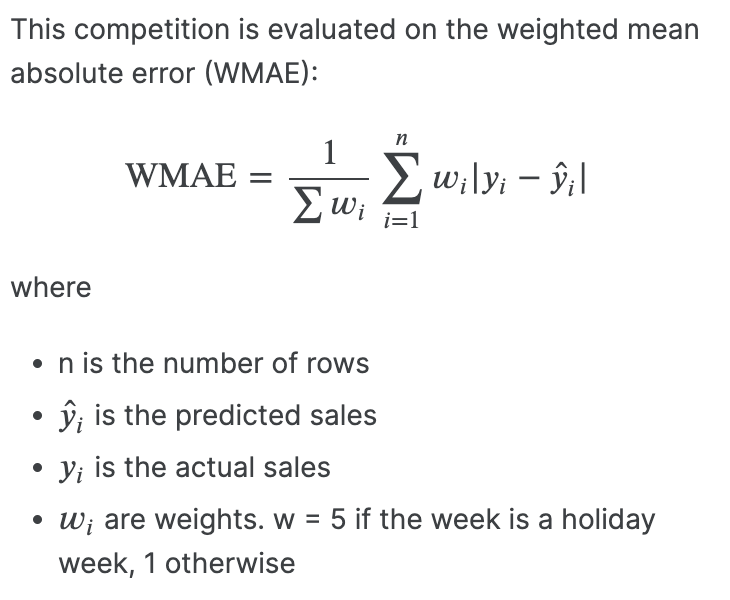
Methodogy
Exploratory Data Analysis
In this part, I analyzed the proportion of data in each store type (A,B,C),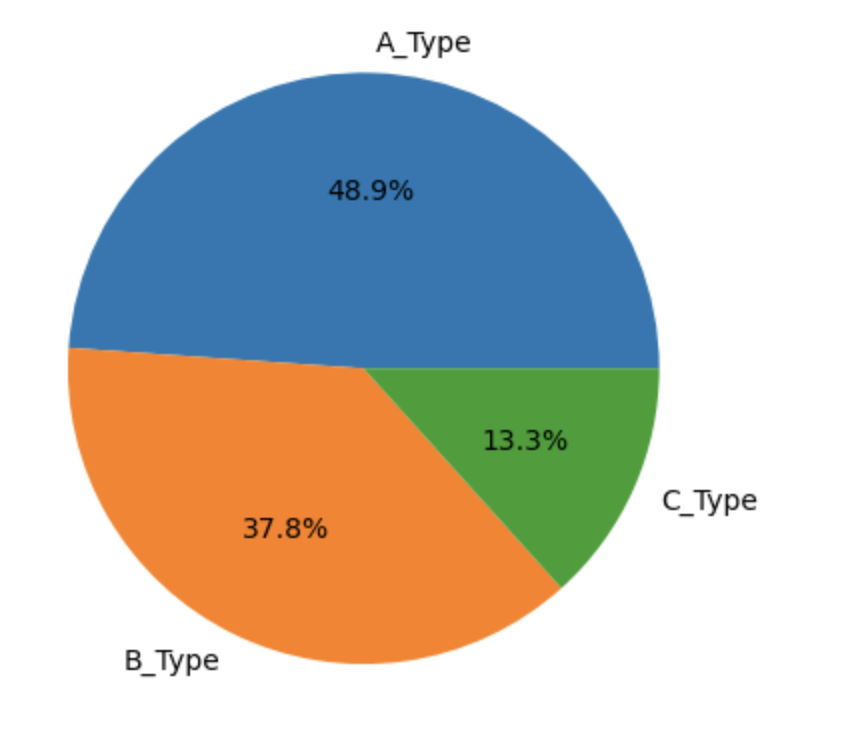
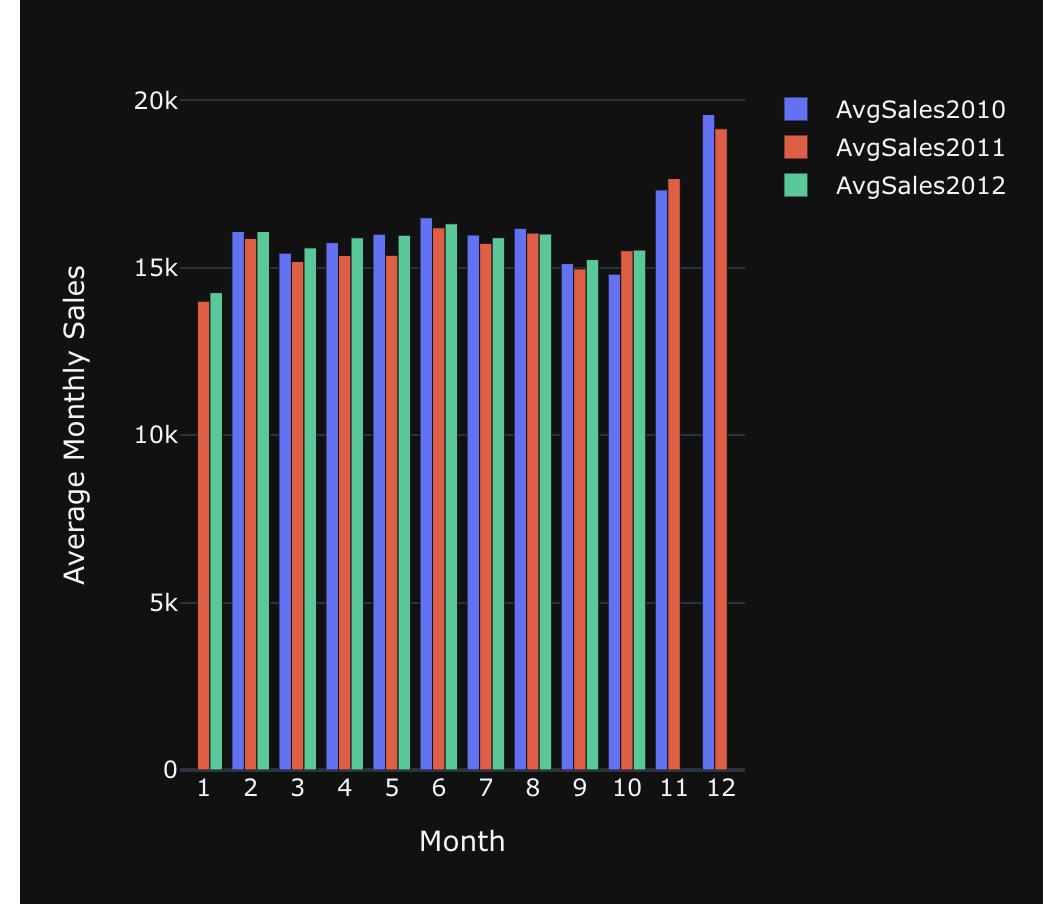
and the average weekly sales, average monthly sales per year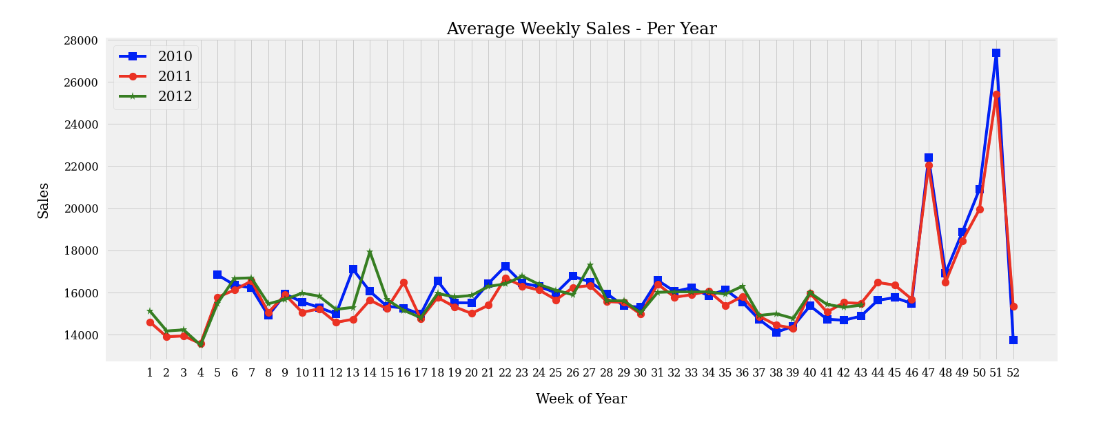
And also the relationship between size of store and sales,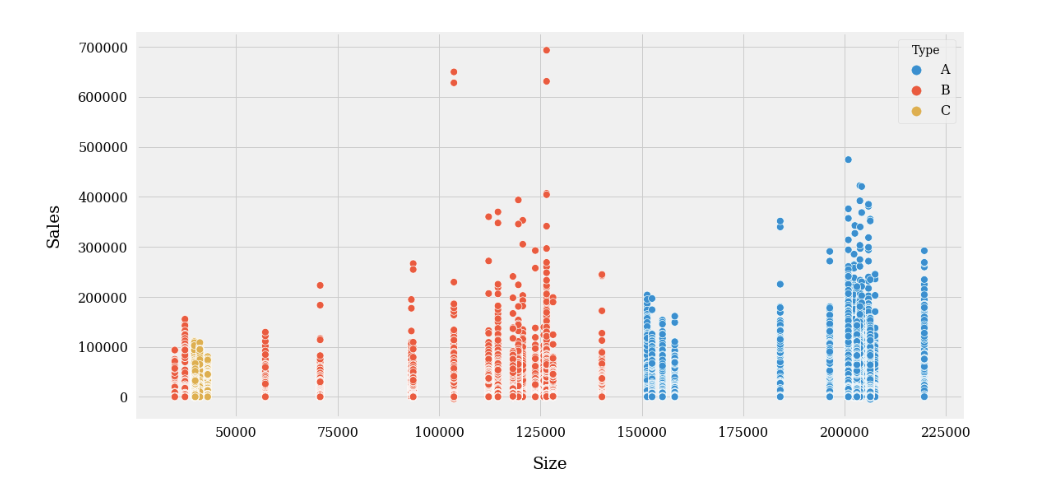
the relationship between temperature and sales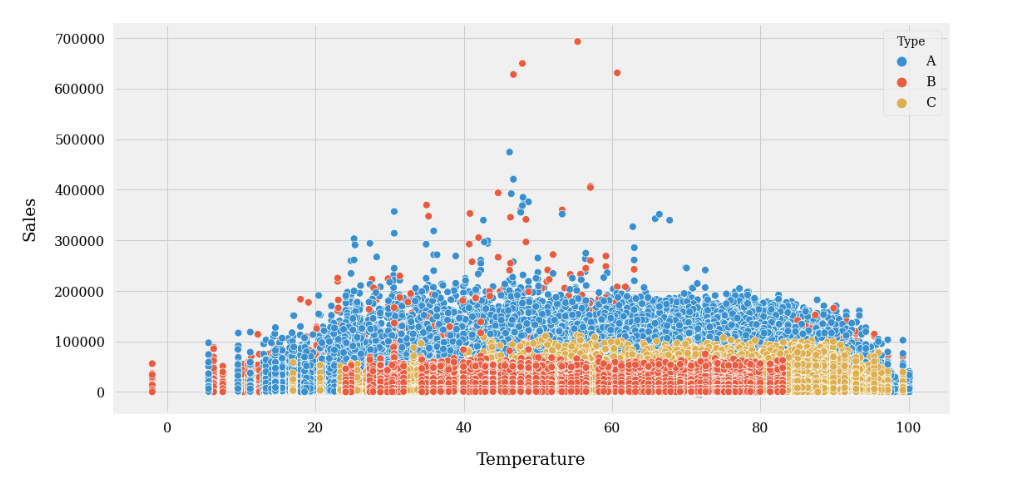
the relationship between fuel price and sales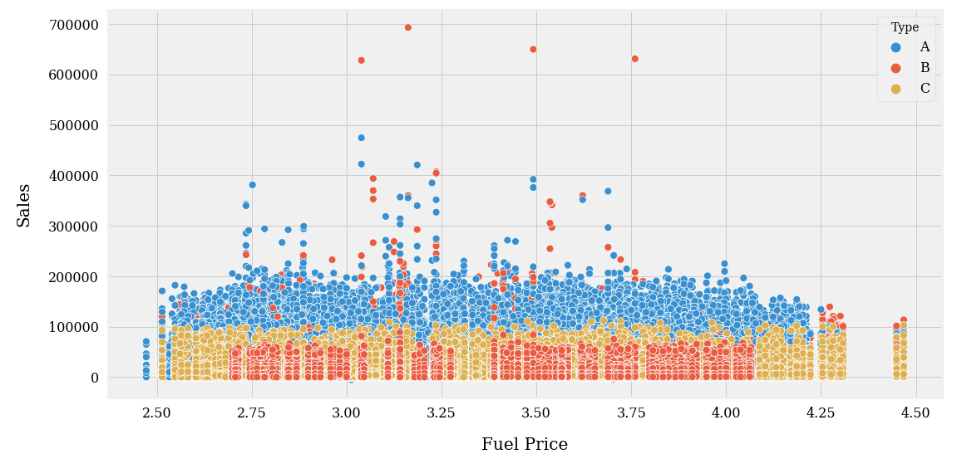
the relationship between CPI and Sales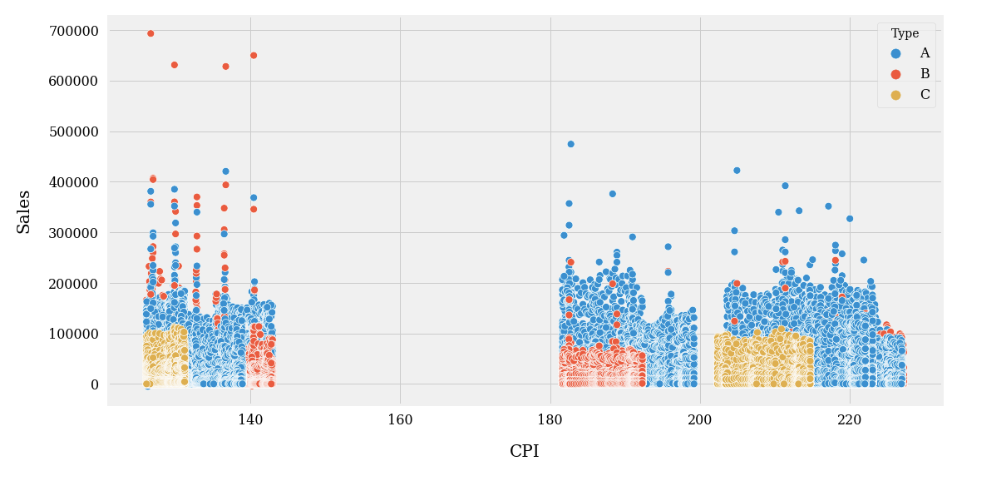
the relationship bettween unemployment and Sales.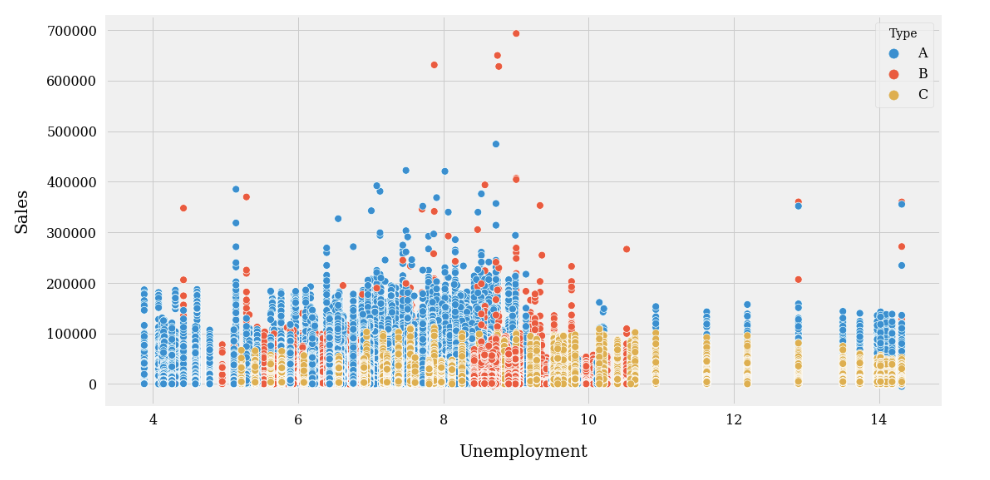
Using Correlation Matrix to check conform the inferences we have concluded from the above EDA study.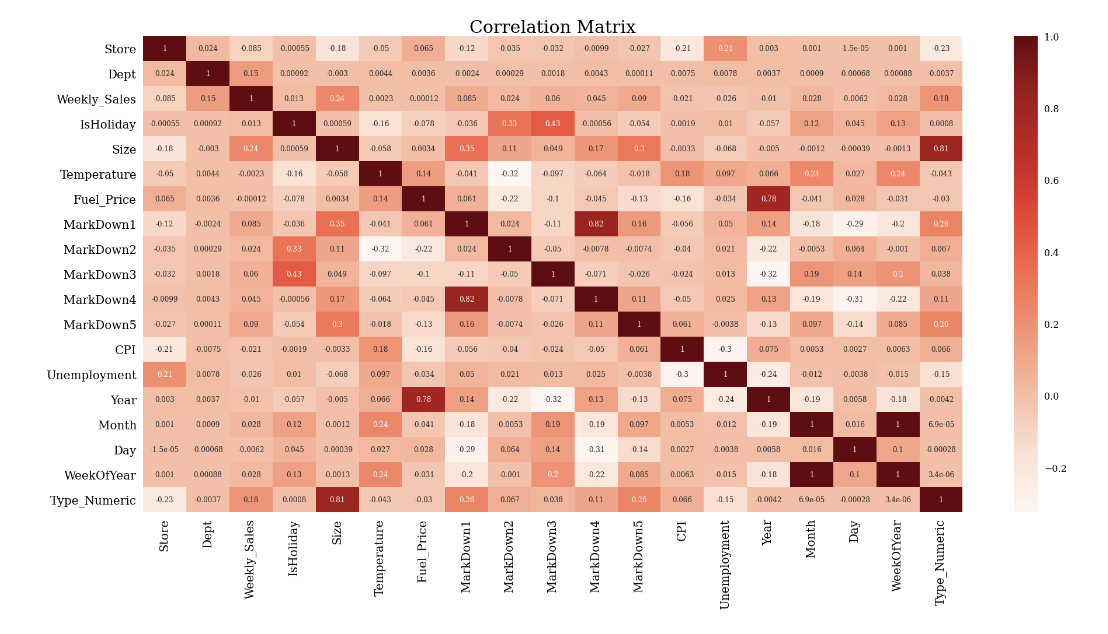
Data Preparation
According to the EDA and Coorelation study, dropped the columns with relationship with the target column. Training and created the training, validation datasets.
Machine Learning
Linear Regression
- WMAE for Training set: 14776.36
- WMAE for Validation set: 14884.37
Decision Tree
- WMAE for Training set: 0.0
- WMAE for Validation set: 1938.54
Random Forest
- WMAE for Training set: 569.99
- WMAE for Validation set: 1571.46
Gradient Bopsting Machine
- WMAE for Training set: 16.66
- WMAE for Validation set: 1339.29
Recent Post
